In Reporting and Analytics dimensions are seldom expected to change as they define the characteristics of a report and are used to segment the facts data. The changes to these dimensions is something that is not expected in the normal course of a business and their change can result in unanticipated outcomes in reporting and analytics.
However, there are instances where a dimension can get changed due to unavoidable circumstances and this can lead to unexpected results reporting and analytics. The changes to these dimensions are not very frequent like fact data and slow changes can occur in them over period of time they, hence they are referred to as Slowly Changing Dimensions
For example – In Sales Reporting the Revenue is grouped by Opportunity Owner’s Manager. However, there can be a change in the Sales Person’s manager over a period of time and this can lead to a change in the Owner Manager’s revenue realization.
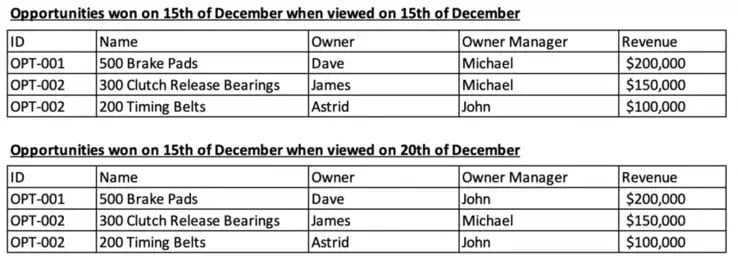
In the above example, On 15th of December Dave was reporting to Michael and on 20th of the month Dave moved to John’s team. What this does is that it moves the revenue Dave generated under Michael on 15th of December to John and reduces Michael’s revenue by $200,000 when the same data is viewed on 20th of December as the reporting has now changed. This gives an inaccurate picture of the revenue earned by a manager on 15th of December!
Historically slowly changing dimensions have been categorized into the following types and different approaches have been considered to address the problem of changing dimensions:
Type 0 – These types of dimensions are fixed and never change.
Type 1 – In this type of dimension no history is maintained and its simply overwritten with the new value.
Type 2 – In this approach a new record is created for every dimension change and the current one marked with an Active Flag.
Type 3 – In this approach a new column is added on the same record to store the previous value.
Type 4 – In this approach the history is maintained in a separate history table with the dimension value and date.
Type 6 – This approach is a combination of 1,2 and 3 where new records are added in the same table with their validity dates, current and historical values. and active flag
The Problem of the 'Not So' Slowly Changing Dimension
In the current dynamic world of business there are frequent changes to a number of dimensions that used to be fixed or change slowly earlier and this has made it very difficult to get a view of how products or people are performing at any given time.
For example, Sales team members are frequently moving across departments and hence it becomes very difficult to track their and their superior’s revenue contributions in each area.
Also, there are certain dimensions which can change more frequently like an Opportunity Stage and these are more suited for current state reporting. However, there can be situations where there is a need to analyze the movements of opportunities over a period of time to come up with pipeline trend and this may require tracking of the changing dimensions with time.
There is no way in the traditional databases and reporting systems to get a point in time vie w of the data and hence getting a view of the system data on a given day is becoming a challenge that directly affects the performance monitoring, revenue attribution and compensation of teams.